See our recent Q&A on the SAGE MethodSpace blog about the challenges of conducting social research using Twitter data.
Methods in Action: Visualizing Social Media Analysis
July 15th, 2016 | Posted by in Case Studies | Published Articles - (0 Comments)Chorus in the classroom
November 24th, 2015 | Posted by in Case Studies | Teaching and Learning - (0 Comments)Dr Phil Brooker reflects on his recent experience of introducing early career researchers to the visual analytic approach
On October 30th, I got the chance to facilitate a 3-hour workshop on doing social media analytics with Chorus, and I’m happy to report that it was a great success!
The workshop formed part of a wider two-day training module, ‘Hearing, Seeing, Doing: Reflexivity, Creativity and Collaborations in Research’, for doctoral students across GW4 universities. The wider course was designed to engage early career researchers in thinking differently about the research process, and the Chorus team was drafted in to lead a workshop on a creative non-traditional/alternative methodology.
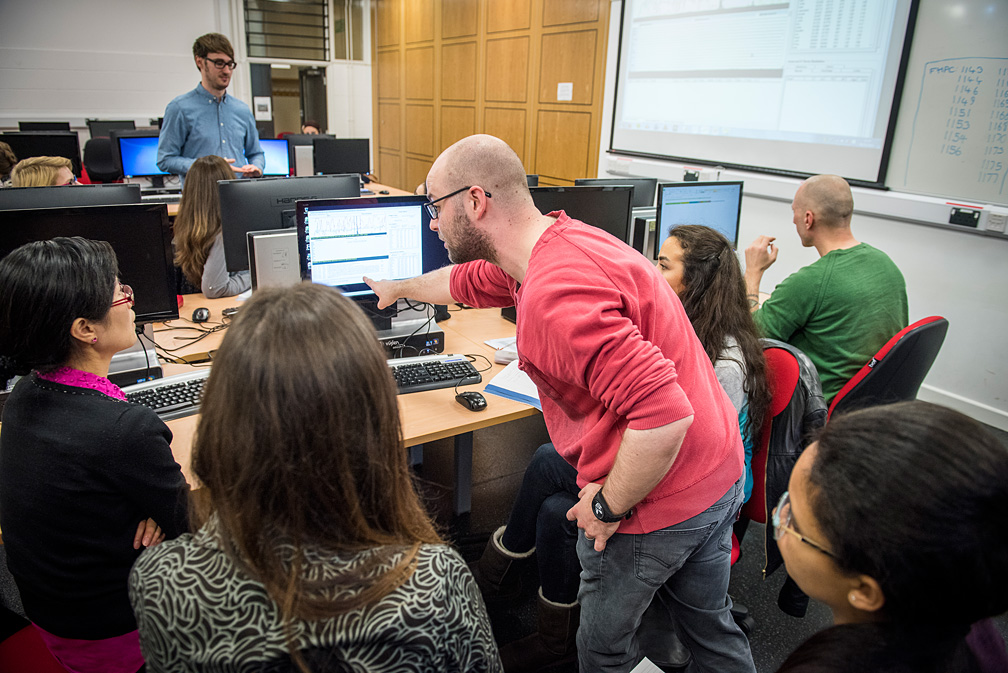
Phil Brooker guides students on using the Timeline Explorer
Reflecting on the use of Chorus as a pedagogical tool, I think the combination of visual models of data and the functions that help users navigate around that data to get back to original tweets was something that students could really get their teeth into. I started the workshop with a talk that set out a ‘visual analytic’ approach to social media data, wherein the visualisations you can see on-screen are not to be viewed as results, but as part of a data exploration process which can lead you back to interesting insights from the original data. From here, students were given chance to use Chorus themselves, first to explore a mock dataset and get a handle on how Chorus operates, then to undertake some data collection and visualisation work themselves on topics relevant to their own research. With the visual analytic approach in mind, the students seemed to get a lot out of probing the Twitter API for interesting data, then finding their way around it with the various visual models Chorus builds. I was careful to emphasise that there’s no such thing as ‘bad data’ – if they were having trouble drawing insights from the data they captured, I encouraged students to see this as an opportunity to learn what was lacking in their data collection strategy and see if they could use that information to go back and collect data better suited to addressing their questions. The interplay between data collection and data visualisation that Chorus offers made this a straightforward process, with students being easily able to switch between the two and reflect on how the data collection and visualisation process itself formulates part of their research as a ‘socio-technical assemblage’.
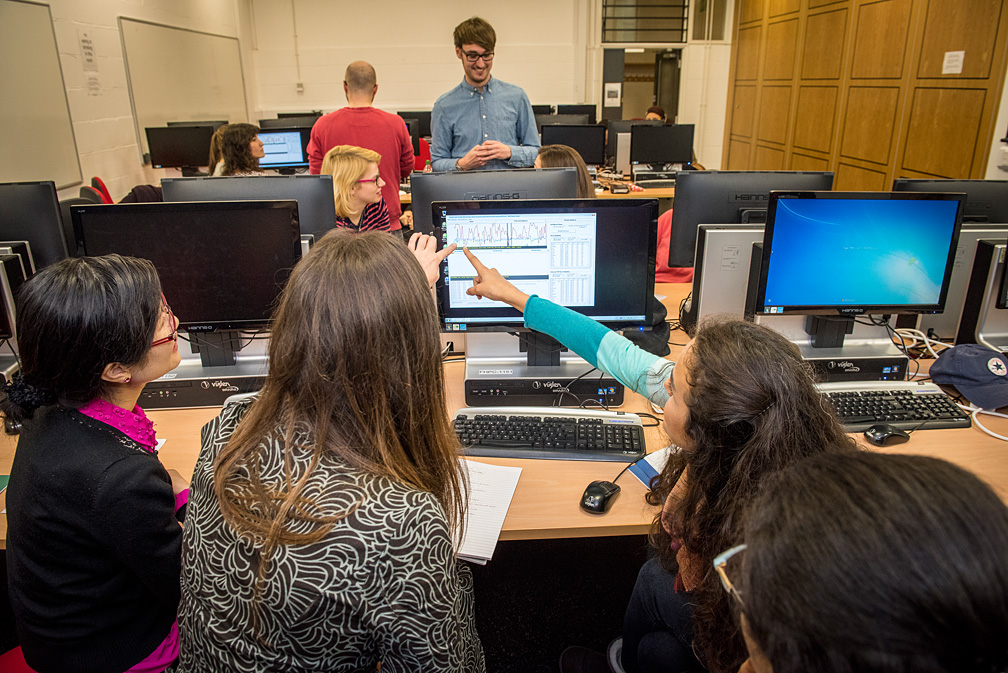
Students soon got to grips with the visual analytic approach
All in all, Chorus proved to be a useful tool for not only demonstrating how to capture and visualise Twitter data, but also for showing how to discover insight and master the research process as it moves between human and computational control. This seems to me to be a great asset to the software – it not only has a use as a tool for undertaking research work in social media analytics, it can help researchers see and understand the underlying methodological thinking that that research work embodies, allowing for a deeper exploration of the topic at hand.
If anyone is interested in using Chorus as part of their teaching, or in hearing more about the workshop course mentioned above, please do get in touch at team@chorusanalytics.co.uk.
Tweeting in government follows the flow of money and power
November 7th, 2014 | Posted by in Case Studies | Published Articles - (0 Comments)Dr Panos Panagiotopoulos is a Lecturer in Management at Queen Mary University of London
Public authorities mainly use social media to communicate with citizens. But they can also use networks like Twitter and LinkedIn to link people with expertise within the public sector. Unfortunately we still know little about how public officials use social media in this context. This article reports new research findings about these networks, from a study of tweets from the Twitter hashtag #localgov. We find that the pattern and direction of Twitter communication in government itself facilitates internal networking while reflecting the structure of power in the British state.
Read the conference paper on which this article is based here
The value of Twitter for non-profit organisations
November 7th, 2014 | Posted by in Case Studies - (0 Comments)By Panayiota Skouroumouni, MSc in Management and Organisational Innovation, Queen Mary University of London
For non-profit organisations, Twitter can be a powerful tool for network building and online engagement with key audiences. Since most non-profits operate with minimum resources, it is important that they have the necessary capacity to monitor engagement and make the most our of their social media presence.
As part of an MSc dissertation in Management and Organisational Innovation at Queen Mary University of London, Chorus tools were used to capture Twitter data from non-profits that focus on humanitarian campaigns related to children. With the help of Tweetcatcher, one years worth of data from July 2013 to July 2014 were captured from a selection of organisational accounts – the total number of tweets collected was 15,549.
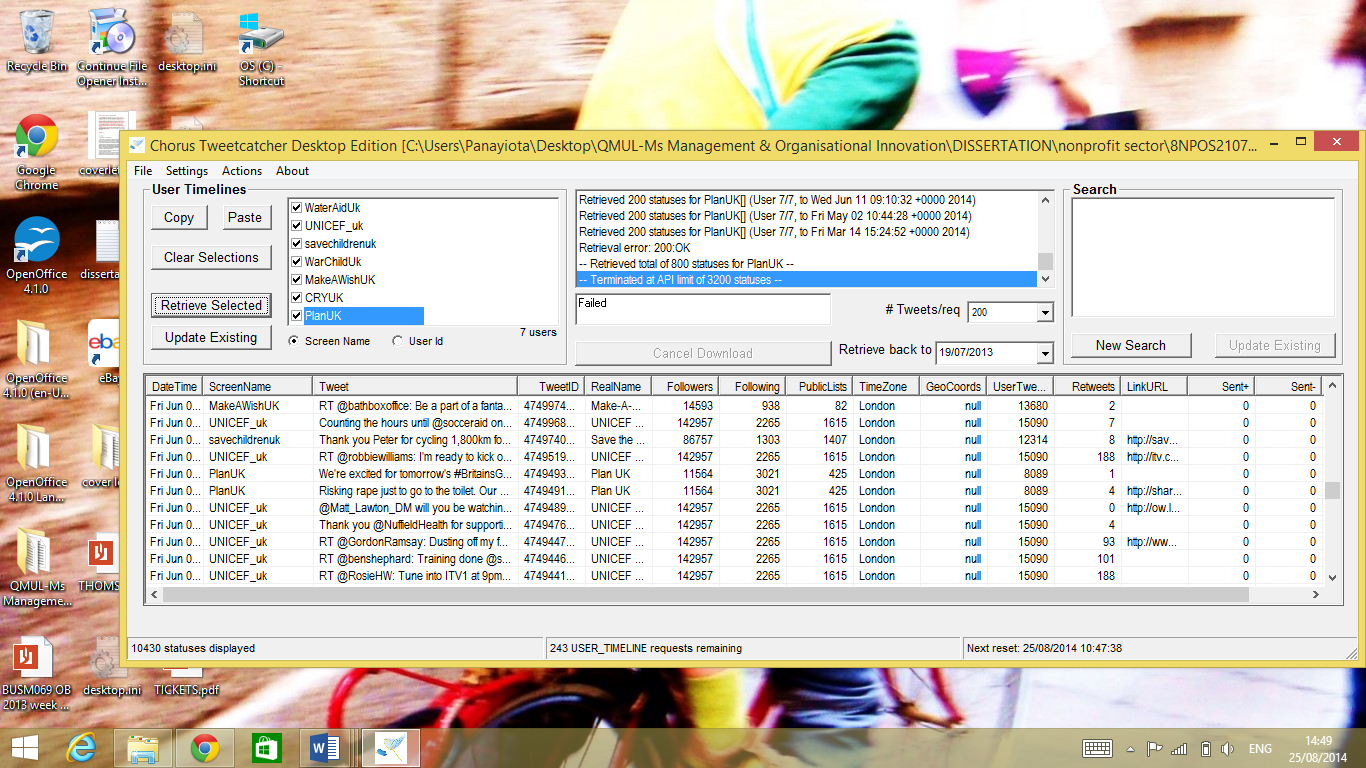
Tweetcatcher was used for capturing tweets posted by children-related non-profit organisations
Tweetvis was then used to understand the patterns of users’ activity through examining structural characteristics of the tweets (e.g. hashtags, retweets, mentions), as well as keyword frequency and sentiment around specific events. Identifying the most frequent words was important as an overview of the most important topics discussed. Hashtags revealed how children-related campaigns were linked to other news and worldwide events.
The study’s main findings how non-profit organisations are trying to build their network through online relationships in several ways, for example:
- Creating and heavily promoting tweets for causes that tend to receive a lot of attention (mentions, retweets).
- Mentioning celebrities in their tweets, who receive a lot of publicity and can lead others to engage with their causes.
- Mentioning/retweeting followers and supporters to involving them more actively in the organisations’ campaigns and possibly expand their influence through further networking effects. This can possibly enhance feeling of belongingness and connectedness among the audience, hence leading to more permanent connections and future action. A common reason of mentioning followers was acknowledgement of support.
- Creating and promoting hashtags – Each hashtag usually represents an event, which forms a community of users with the same interests, involved in the same conversation.
- Joining world-wide conversations about major events that attract the attention of Twitter users – During the time of this study, these included: the 3rd anniversary of conflict in Syria, the escalating war in Gaza, the abduction of schoolgirls in Nigeria, the typhoon in Philippines and the World Cup of June 2014 taking place in Brazil. A more advanced tactic used to attract attention to was “newsjacking”, where campaign-related content is inserted into contemporary media coverage like popular or breaking news. For instance, this infographic was created by the charity Save the Children during the London tube strike and received a lot of attention as well as controversy.
Rapid Insight into Blood Glucose Monitor Issues using Chorus Twitter Analytics
June 25th, 2014 | Posted by in Case Studies - (0 Comments)A collaborative and evaluative study conducted by members of the Chorus Team at Brunel University and social media representatives from a leading bio-pharmaceutical company who distribute blood glucose monitors (BGM) as part of their treatment portfolio for people living with diabetes. This study takes data from Twitter to attempt to answer questions of genuine interest to this sector of the medical device market, conducting a small-scale (one day) analysis in order to ascertain any valuable insight may quickly and easily be drawn from the data collected. Data was collected, using the Tweetcatcher, over a 10 week period during 2013 and all analyses were conducted using Tweetvis.
Research Interests
- The company had a concern with breaking into a BGM market dominated by established companies and devices, and are interested in exploring various questions around this. One question was “Is it possible to locate opinions, on Twitter, around aspects of existing devices which users think are positive/negative?”. Following this, they were also interested in how device design influenced daily usage: “Is there any discussion of the possible impacts that devices themselves might have on users’ adherence to testing schedules, especially where this information can be tied into specific brands of device?”
- The company had a secondary concern with how devices are represented by clinicians and other staff in clinical contexts, in terms of whether any particular brands are favoured, and what work might be done to increase brand uptake in specific ways. One key question was “Is there any discussion, on Twitter, of barriers to the uptake of certain devices on a clinical level, for e.g. advice and recommendations from GPs or nurses, etc?”. Related to this, another question was “Do devices users follow clinical advice in this regard?”
Brief Summary of Findings and Recommendations
Twitter proved to be a surprisingly rich source of discourse around the topic of blood glucose monitoring and management. Whilst constructing effective keyword queries proved difficult – acceptably precise queries tended to provide low recall and were dominated by spam – it was still possible to draw out some useful insights relevant to the questions.
Keyword search
Some interesting themes that were quickly identified within query keyword datasets (i.e. “strips AND glucose”, “glucose AND tests” and “glucose AND (device OR monitor OR meter)”) included:
- Clear expressions of interest in blood glucose monitors that could integrate with existing commonly-used high-uptake technologies, particularly smartphones.
Frequent mentions of smartphones were found in the “glucose AND (device OR monitor OR meter)” dataset
The perceived benefits were that this would remove the burden of carrying an extra device whilst providing the facility to readily aggregate and monitor glucose levels over time. There was also much excitement over the rumours that Apple were going to release an iWatch, complete with sensors to monitor glucose continuously without the need for needles
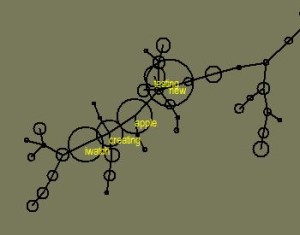
Discourse within the “glucose AND (device OR monitor OR meter)” dataset was dominated by references to an article about the iWatch
Also:
- Engaging with the blood glucose device market with a digitally-savvy approach (i.e. demonstrative YouTube tutorials on device operation, answering user questions via a company Twitter account, etc) could provide a cheap and easy way to increase brand/device awareness.
- Reliability of devices and accuracy of readings (for both strips and devices) is the key concern of device users – in this regard, users desire the automation and hands-off nature of continuous blood glucose monitoring (and as such it may be profitable to develop devices to reflect continuous monitoring techniques).
- Losing/forgetting devices is a key issue for device users, who report instances when they need to check their blood glucose levels but cannot do so due to having lost the device or left it at home etc. Hence, the ‘loseability’ of devices is a key aspect of peoples’ insecurities about relying on them, and finding ways to make devices less ‘loseable’ or mitigate the consequences of losing a device may improve how those devices are thought of by users.
User Following
A more successful strategy was to retrieve the recent timelines of users who followed a popular information service, in this case an account run by a diabetes safety campaign – @StripSafely. We call this strategy “User Following”. User following avoids the need to specify keywords. This is particularly useful for anthropological research – why would a diabetes sufferer mention their condition or related activities specifically every time they tweeted about it? The trade for improved recall is precision, but with sufficient numbers of users in the sample, the key themes tend to bubble to the surface and can be readily identified in the visualisations and statistics provided by Chorus, enabling the analyst to filter their dataset to pursue a more in-depth analysis. This approach revealed the following insights:
- Followers of @StripSafely were found to participate in a regular weekly diabetes discussion organised around the hashtag #dsma. This is an event which occurs every Thursday at 9PM EST, and this provides a focal point for any social media engagement that the company may wish to pursue (i.e. there are more people on Twitter discussing various issues in and around diabetes at this time, so the potential audience for blood glucose monitoring devices is maximal at this time).
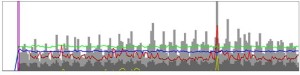
A regular peak in activity around Thursdays is evident in the Tweetvis Timeline view
The @StripSafely dataset (n = 182809) was filtered down within Excel to only include tweets containing the #dsma tag. This reduced the set size to n = 11880. From this reduced set we found:
- People engaging in the #dsma debate regularly link specific device issues with specific device brands, and very clearly state a wide array of opinions on what they do and do not like about existing devices. In this sense, it is possible to use social media and user-following data to capture many different positive experiences of devices (and possibly capitalise on them in future device development) as well as negative ones (and work to rectify those in devices endorsed by the company).
- User-following datasets also allow for explorations of device recommendations and advice coming from a clinical context, and also display their adherence to that device post-consultation (i.e. their clinicians may recommend a specific device, but they may report preferring or even having bought a different one). These insights are locatable through usages of general occupational terms such as “nurse”, “doc”, “doctor”, “endo” etc, which are difficult to handle in a systematic way as part of a query keyword search.
This post is only an abridged version of the method and findings of the above study. If interested, please direct any enquiries to team@chorusanalytics.co.uk
User-driven data capture: Locating and Analysing Twitter Conversation about Cystic Fibrosis without Keywords
June 24th, 2014 | Posted by in Case Studies | Published Articles - (0 Comments)The power and promise of social media as a resource and tool for doing social research is widely recognised and much vaunted. Social media data is becoming an increasingly attractive resource for social scientists, but the question remains as to what exactly we might want to do with data like this. The present study describes a small-scale interdisciplinary project in medical sociology which instigated the development of an innovative method for making practical use of ‘big data’ drawn from Twitter. What results is a depiction of how a collaboration between software developers, requirements engineers and social scientists demonstrated a need for a new method of data capture, a description of the method by which that need was addressed, and a discussion of the value of the insights that can be drawn through using that method.
Brooker, P., Barnett, J., Cribbin, T., Lang, A., & Martin, J. (2013). User-Driven Data Capture: Locating and Analysing Twitter Conversation about Cystic Fibrosis without Keywords. In SAGE Research Methods Cases. London, United Kingdom: SAGE Publications, Ltd. doi: http://dx.doi.org/10.4135/978144627305014526813
#notracist: Multi-hashtags and Ambient Race-Talk on Twitter
June 16th, 2014 | Posted by in Case Studies - (0 Comments)Twitter is known for the abundance of racialized messages posted on its platform. Eruptions of racist abuse occur within a contested array of Twitter discourses, e.g. racial banter, ambivalent humour, hate comments and (anti-)racist sentiments. Surprisingly, only limited studies of everyday ‘race-talk’ on Twitter have been undertaken, and little is known about its ambient stream of racialized expression.
This project explored how racialised messages unfold in Twitter by focusing on the hashtag #notracist. Twitter users can include this (and other related) hashtags in messages to label seemingly ‘racist’ statements (and images/videos) as ‘not racist’. The practice of hashtagging as a strategy of denying racist expression or propagating the ambiguities of race talk enables an understanding of the contested racialized digital ecology of Twitter.
The project is funded by British Academy/Leverhulme Small Research Grant (Apr 2013 – May 2014).
-
Principal Investigator: Dr Sanjay Sharma (Brunel University); sanjay.sharma@brunel.ac.uk; twitter: @sanjay_digital
-
Research Associate: Dr Phillip Brooker (Brunel University)
Multi-Hashtagging
A significant tweeting practice we note in the #notracist dataset is the usage of more than one hashtag in a tweet – a phenomena we call Multi-Hashtagging.1) For the #notracist dataset, aside from the original#notracist term, there are a further 7717 hashtags, which are used in a variety of ways, for example:2)
-
helen_louise_: I literally cant stop eating watermelon. & Im not even black. #NotRacist #JustSaying
-
PaneKilla: How to say the alphabet in vietnamese #funny #notracist #accent #alphabet #vietnamese#peace #lol http://instagram.com/p/…
Analytic Work
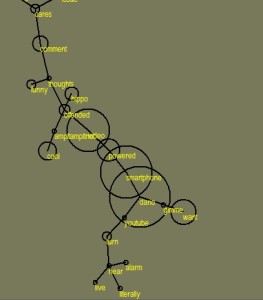
We used Chorus to plot a ‘cluster map’ of key multi-hashtags (fig. 1). The Chorus software suite includes a Cluster Explorer feature, which enables the co-occurrence of any terms within a Tweet to be identified.
 Fig. 1: Hashtag cluster map
In this map, each node (i.e. point in the map) is a hashtag, and the position and connectivity of nodes is determined by how frequently those hashtags are used together (co-occurrence), such that ‘similar’ hashtags cluster together (i.e. ones which are used in comparable ways to express similar sentiments). The model reveals how hashtags relate to each other as ‘semantic’ entities. The two radials overlaid on the image facilitate the process of reading the visualisation.
Source: http://www.darkmatter101.org/wiki/notracist_twitter
Copyright © 2024 All rights reserved.
Designed by 