We’ve made some useful updates to Tweetcatcher, mainly the ability to retrieve the full text of original tweets (up to 280 chars). If you want to try, please download and replace your existing TCDE.exe with this file. It’s not been fully tested yet, but works fine on our PCs.
Author Archives: ch_admin
Tweetcatcher now retrieves 280 char tweets
March 2nd, 2020 | Posted by in Uncategorized - (0 Comments)Detecting psychological change through mobilizing interactions and changes in extremist linguistic style
February 10th, 2020 | Posted by in Published Articles - (0 Comments)Social media interactions are popularly implicated in psychological changes like radicalization. However, there are currently no viable methods to assess whether social media interactions actually lead to such changes. The purpose of the current research was to develop a methodological paradigm that can assess such longitudinal change in individuals’ social media posts. Using this method, we analyzed the longitudinal timelines of 110 Twitter users (40,053 tweets) who had expressed support for Daesh (also known as Islamic State, or ISIS) and we compared them to a baseline sample of twitter timelines (215,008 tweets by 109 users) to investigate the factors associated with within-person increases in conformity to the vernacular and linguistic style of tweets that supported violent extremism. We found that conformity to both extremist group vernacular and linguistic style increased over time, and with mobilizing online interactions. Thus, we show how to detect within-person changes over time in social media data and suggest why these changes occur, and in doing so, validate a methodological paradigm that can detect and predict within-person change in psychological group memberships through social media interactions.
Smith, L. G. E., Wakeford, L., Cribbin, T. F., Barnett, J., & Hou, W. K. (2020, in press). Detecting psychological change through mobilizing interactions and changes in extremist linguistic style. Computers in Human Behavior. https://doi.org/10.1016/j.chb.2020.106298
Free access is available to this article until April 18th 2020 by clicking here
The Graphviz site has changed, which means the old link for downloading the installer no longer works. You should now get the latest installer from https://graphviz.gitlab.io/_pages/Download/Download_windows.html . The Downloads page has now been updated to reflect this.
A new version of Tweetvis has been released and is available in the Downloads section. This is a maintenance release that fixes a few reported bugs associated with data file loading and pre-processing.
Methods in Action: Visualizing Social Media Analysis
July 15th, 2016 | Posted by in Case Studies | Published Articles - (0 Comments)See our recent Q&A on the SAGE MethodSpace blog about the challenges of conducting social research using Twitter data.
New Chorus team publication: Doing Social Media Analytics
July 11th, 2016 | Posted by in Published Articles - (0 Comments)In the few years since the advent of ‘Big Data’ research, social media analytics has begun to accumulate studies drawing on social media as a resource and tool for research work. Yet, there has been relatively little attention paid to the development of methodologies for handling this kind of data. The few works that exist in this area often reflect upon the implications of ‘grand’ social science methodological concepts for new social media research (i.e. they focus on general issues such as sampling, data validity, ethics, etc.). By contrast, we advance an abductively oriented methodological suite designed to explore the construction of phenomena played out through social media. To do this, we use a software tool – Chorus – to illustrate a visual analytic approach to data. Informed by visual analytic principles, we posit a two-by-two methodological model of social media analytics, combining two data collection strategies with two analytic modes. We go on to demonstrate each of these four approaches ‘in action’, to help clarify how and why they might be used to address various research questions.
Brooker, P., Barnett, J., & Cribbin, T. (2016). Doing social media analytics. Big Data & Society, 3(2). Download paper
Have we even solved the first ‘big data challenge?
January 20th, 2016 | Posted by in Published Articles - (0 Comments)Harvesting and visualising ‘big’ social media data is an increasingly feasible practice for social scientists. Yet whilst there is an emerging and substantial body of literature utilising social media as a data resource, there are a number of computational issues affecting data collection and analysis that for the large part remain hidden from the researcher’s view but which may problematise the findings we can legitimately draw from social media. This chapter outlines and explores two such issues as they occur for data taken from Twitter , commenting on how they might be handled in the undertaking of digital social science research. Here, we agree wholeheartedly subscribe to with Procter et al.’s insistence ‘that social researchers be trained in the underlying concepts of computational methods and tools so they can decide when and how to apply them’ (2013: 209). As such, we aim to outline highlight certain technical features and/or constraints pertaining to the collection and processing of Twitter data. In doing this we aim to, thereby helping help researchers to incorporate a technical understanding of the mechanics of digital research tools into robust and thoughtful analyses of their data.
Brooker, P., Barnett, J., Cribbin, T., & Sharma, S. (2015). Have we even solved the first ‘big data challenge?’ Practical issues concerning data collection and visual representation for social media analytics. In H. Snee, C. Hine, Y. Morey, S. Roberts, & H. Watson (Eds.), Digital Methods for Social Science: An Interdisciplinary Guide to Research Innovation. Palgrave Macmillan. http://www.palgrave.com/page/detail/Digital-Methods-for-Social-Science/?sf1=barcode&st1=9781137453655 or e-copy on Google Books
A maintenance release that fixes some bugs identified in the recent version update. This can be downloaded from the Downloads page.
Chorus in the classroom
November 24th, 2015 | Posted by in Case Studies | Teaching and Learning - (0 Comments)Dr Phil Brooker reflects on his recent experience of introducing early career researchers to the visual analytic approach
On October 30th, I got the chance to facilitate a 3-hour workshop on doing social media analytics with Chorus, and I’m happy to report that it was a great success!
The workshop formed part of a wider two-day training module, ‘Hearing, Seeing, Doing: Reflexivity, Creativity and Collaborations in Research’, for doctoral students across GW4 universities. The wider course was designed to engage early career researchers in thinking differently about the research process, and the Chorus team was drafted in to lead a workshop on a creative non-traditional/alternative methodology.
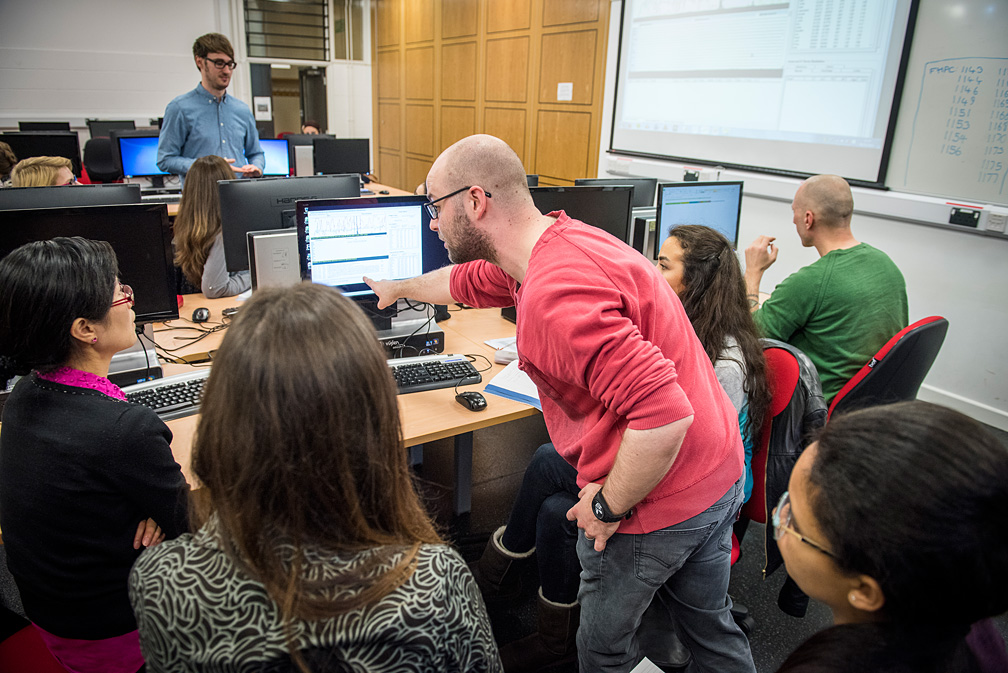
Phil Brooker guides students on using the Timeline Explorer
Reflecting on the use of Chorus as a pedagogical tool, I think the combination of visual models of data and the functions that help users navigate around that data to get back to original tweets was something that students could really get their teeth into. I started the workshop with a talk that set out a ‘visual analytic’ approach to social media data, wherein the visualisations you can see on-screen are not to be viewed as results, but as part of a data exploration process which can lead you back to interesting insights from the original data. From here, students were given chance to use Chorus themselves, first to explore a mock dataset and get a handle on how Chorus operates, then to undertake some data collection and visualisation work themselves on topics relevant to their own research. With the visual analytic approach in mind, the students seemed to get a lot out of probing the Twitter API for interesting data, then finding their way around it with the various visual models Chorus builds. I was careful to emphasise that there’s no such thing as ‘bad data’ – if they were having trouble drawing insights from the data they captured, I encouraged students to see this as an opportunity to learn what was lacking in their data collection strategy and see if they could use that information to go back and collect data better suited to addressing their questions. The interplay between data collection and data visualisation that Chorus offers made this a straightforward process, with students being easily able to switch between the two and reflect on how the data collection and visualisation process itself formulates part of their research as a ‘socio-technical assemblage’.
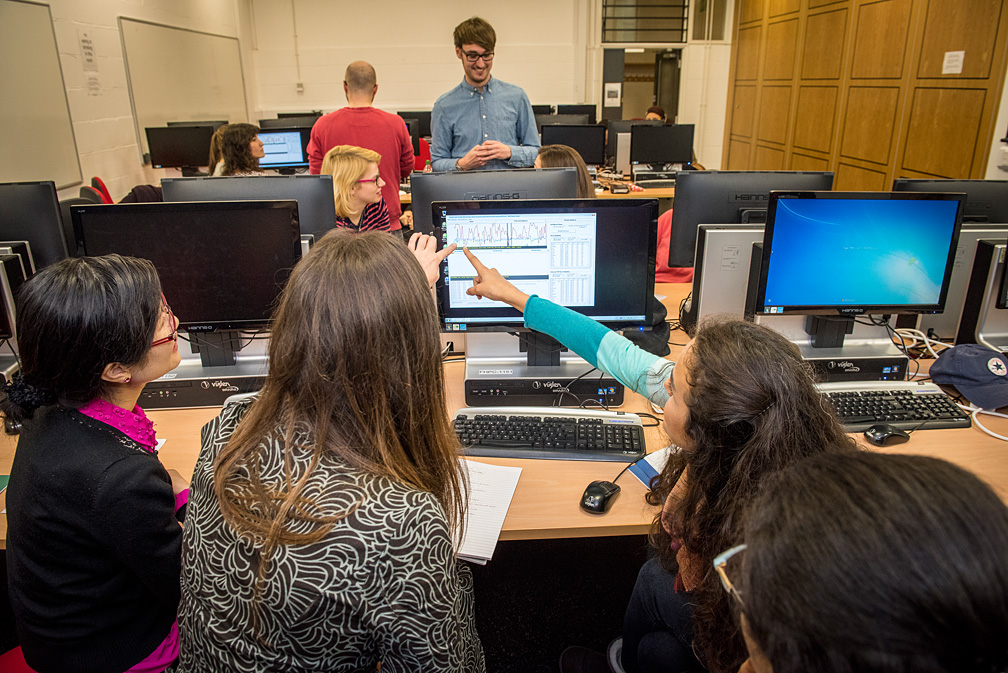
Students soon got to grips with the visual analytic approach
All in all, Chorus proved to be a useful tool for not only demonstrating how to capture and visualise Twitter data, but also for showing how to discover insight and master the research process as it moves between human and computational control. This seems to me to be a great asset to the software – it not only has a use as a tool for undertaking research work in social media analytics, it can help researchers see and understand the underlying methodological thinking that that research work embodies, allowing for a deeper exploration of the topic at hand.
If anyone is interested in using Chorus as part of their teaching, or in hearing more about the workshop course mentioned above, please do get in touch at team@chorusanalytics.co.uk.
A new release of Tweetcatcher (TCD 1.3.0) is now available. This incorporates many bug-fixes, new functions and usability improvements. Thanks to all of you who provided feedback via email and the recent survey. We hope this new release improves the utility of TCD for research as well as the overall user experience. This is a beta release, but will be incorporated into the standard installation package soon. Please provide feedback (team@chorusanalytics.co.uk) if you spot any remaining/new bugs.

TCD 1.3.0 can be downloaded here. After copying to your Chorus folder, make sure to rename the file to TCD.exe to ensure any short-cuts still work.
Release Notes:
- Bug fixes
- Presence of inverted commas no longer causes Tweet text to be truncated
- Unicode character codes (e.g. \ud0d) are now intercepted and either converted into an ascii equivalent or an otherwise informative tag. For instance, non-latin characters are replaced by general tags (e.g. [ar] = Arabic, [el] = Greek)
- Retweet deletion is much faster now for large datasets
- Sorting by numerical fields (e.g. followers) now works properly
- Non-UK datetime formats (e.g. mm/dd/yyyy, yyyy/mm/dd) are now handled correctly. Previously this caused TCD to inexpicably retrieve zero tweets for some users. Datetime conversion should also work for all formats now.
- History lists allow easy navigation back to recent user timeline and query search sessions; last query search loaded automatically (data and query)
- More powerful and usable tools for building, exploring and maintaining user lists
- Right click existing user or enter screenname to get friends/followers
- Build user list from displayed Tweet set
- Add single users to list directly from Tweets or from user input
- Remove single users from a user list
- View user profile metadata for any user in list
- Full metadata table of any user list can be copied to clipboard using the menu for e.g. to allow editing of lists in Excel. Edited lists (screen names only) or full tables can be pasted back to TCD using the menu
- New features for analysing and manipulating Tweets
- Navigate directly to embedded URL from Tweet using context menu (right click)
- Navigate to user Twitter page from Tweet using context menu
- Delete selected tweet or all tweets by the author of a selected tweet (context menu)
- Filter Tweets table by keyword or phrase
- Setting to save column headers with a Tweets file (useful if exporting to Excel etc.)
- Removed several less useful fields from the Tweets table and replaced with more useful ones:
- Other UI improvements
- Presentation of session log is now more informative and compact
- Adjustments to column widths on Tweets table are now remembered next time TCD opens
- Button linking in Search frame to Twitter page providing query syntax help
- Reinstatement of the Cancel operation button
- Unsaved data status is now shown by means of an asterisk on the filename in the title bar
- Usability improvements wrt to the data save process (e.g. will prompt to save unsaved data if running a new query, warn before over-writing existing files etc.)
Copyright © 2024 All rights reserved.
Designed by 