
A collaborative and evaluative study conducted by members of the Chorus Team at Brunel University and social media representatives from a leading bio-pharmaceutical company who distribute blood glucose monitors (BGM) as part of their treatment portfolio for people living with diabetes. This study takes data from Twitter to attempt to answer questions of genuine interest to this sector of the medical device market, conducting a small-scale (one day) analysis in order to ascertain any valuable insight may quickly and easily be drawn from the data collected. Data was collected, using the Tweetcatcher, over a 10 week period during 2013 and all analyses were conducted using Tweetvis.
Research Interests
- The company had a concern with breaking into a BGM market dominated by established companies and devices, and are interested in exploring various questions around this. One question was “Is it possible to locate opinions, on Twitter, around aspects of existing devices which users think are positive/negative?”. Following this, they were also interested in how device design influenced daily usage: “Is there any discussion of the possible impacts that devices themselves might have on users’ adherence to testing schedules, especially where this information can be tied into specific brands of device?”
- The company had a secondary concern with how devices are represented by clinicians and other staff in clinical contexts, in terms of whether any particular brands are favoured, and what work might be done to increase brand uptake in specific ways. One key question was “Is there any discussion, on Twitter, of barriers to the uptake of certain devices on a clinical level, for e.g. advice and recommendations from GPs or nurses, etc?”. Related to this, another question was “Do devices users follow clinical advice in this regard?”
Brief Summary of Findings and Recommendations
Twitter proved to be a surprisingly rich source of discourse around the topic of blood glucose monitoring and management. Whilst constructing effective keyword queries proved difficult – acceptably precise queries tended to provide low recall and were dominated by spam – it was still possible to draw out some useful insights relevant to the questions.
Keyword search
Some interesting themes that were quickly identified within query keyword datasets (i.e. “strips AND glucose”, “glucose AND tests” and “glucose AND (device OR monitor OR meter)”) included:
- Clear expressions of interest in blood glucose monitors that could integrate with existing commonly-used high-uptake technologies, particularly smartphones.

Frequent mentions of smartphones were found in the “glucose AND (device OR monitor OR meter)” dataset
The perceived benefits were that this would remove the burden of carrying an extra device whilst providing the facility to readily aggregate and monitor glucose levels over time. There was also much excitement over the rumours that Apple were going to release an iWatch, complete with sensors to monitor glucose continuously without the need for needles
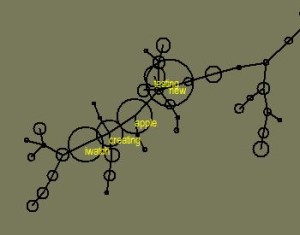
Discourse within the “glucose AND (device OR monitor OR meter)” dataset was dominated by references to an article about the iWatch
Also:
- Engaging with the blood glucose device market with a digitally-savvy approach (i.e. demonstrative YouTube tutorials on device operation, answering user questions via a company Twitter account, etc) could provide a cheap and easy way to increase brand/device awareness.
- Reliability of devices and accuracy of readings (for both strips and devices) is the key concern of device users – in this regard, users desire the automation and hands-off nature of continuous blood glucose monitoring (and as such it may be profitable to develop devices to reflect continuous monitoring techniques).
- Losing/forgetting devices is a key issue for device users, who report instances when they need to check their blood glucose levels but cannot do so due to having lost the device or left it at home etc. Hence, the ‘loseability’ of devices is a key aspect of peoples’ insecurities about relying on them, and finding ways to make devices less ‘loseable’ or mitigate the consequences of losing a device may improve how those devices are thought of by users.
User Following
A more successful strategy was to retrieve the recent timelines of users who followed a popular information service, in this case an account run by a diabetes safety campaign – @StripSafely. We call this strategy “User Following”. User following avoids the need to specify keywords. This is particularly useful for anthropological research – why would a diabetes sufferer mention their condition or related activities specifically every time they tweeted about it? The trade for improved recall is precision, but with sufficient numbers of users in the sample, the key themes tend to bubble to the surface and can be readily identified in the visualisations and statistics provided by Chorus, enabling the analyst to filter their dataset to pursue a more in-depth analysis. This approach revealed the following insights:
- Followers of @StripSafely were found to participate in a regular weekly diabetes discussion organised around the hashtag #dsma. This is an event which occurs every Thursday at 9PM EST, and this provides a focal point for any social media engagement that the company may wish to pursue (i.e. there are more people on Twitter discussing various issues in and around diabetes at this time, so the potential audience for blood glucose monitoring devices is maximal at this time).
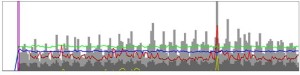
A regular peak in activity around Thursdays is evident in the Tweetvis Timeline view
The @StripSafely dataset (n = 182809) was filtered down within Excel to only include tweets containing the #dsma tag. This reduced the set size to n = 11880. From this reduced set we found:
- People engaging in the #dsma debate regularly link specific device issues with specific device brands, and very clearly state a wide array of opinions on what they do and do not like about existing devices. In this sense, it is possible to use social media and user-following data to capture many different positive experiences of devices (and possibly capitalise on them in future device development) as well as negative ones (and work to rectify those in devices endorsed by the company).
- User-following datasets also allow for explorations of device recommendations and advice coming from a clinical context, and also display their adherence to that device post-consultation (i.e. their clinicians may recommend a specific device, but they may report preferring or even having bought a different one). These insights are locatable through usages of general occupational terms such as “nurse”, “doc”, “doctor”, “endo” etc, which are difficult to handle in a systematic way as part of a query keyword search.
This post is only an abridged version of the method and findings of the above study. If interested, please direct any enquiries to team@chorusanalytics.co.uk
